


Trading is as much about emotions and pressure creation as it is about numbers. Therefore, the use of formulas allows the trader an opportunity, at least for the moment, to separate from emotional distractions and instead focus on a consistent and reliable course of positive action.
These are more than formulas for addition and subtraction, these are formulas that create the rails upon which one can be sure they’re doing the best thing when it’s time to trade.
Whether trying to acquire an opportunity or safeguarding an investment, these are the basic elements that can be a game changer for any trader. Let’s take a look:
Type 1: Technical Analysis Formulas
Technical analysis is a trader’s lens into market behavior, and two standout formulas, MACD and RSI, are must-knows for spotting opportunities.
Moving Average Convergence Divergence (MACD)
MACD is an indicator of momentum that highlights the connection between two different moving averages of a security’s price. For instance, it subtracts the 26-day EMA from the 12-day EMA to get the MACD line, which is compared to the 9-day EMA signal line.
A bullish cross takes place when this MACD line moves over the signal life with a bearish signal occurring when it moves below. An excellent secondary indicator to confirm trends and momentum, but traders must be aware of whipsaw in non-trending, sideways markets.
MACD can be used in concert with the volume indicator to sidestep such crossing signals, but this is important for equity such as Tesla, which has so much unpredictability during earnings season.
Relative Strength Index (RSI):
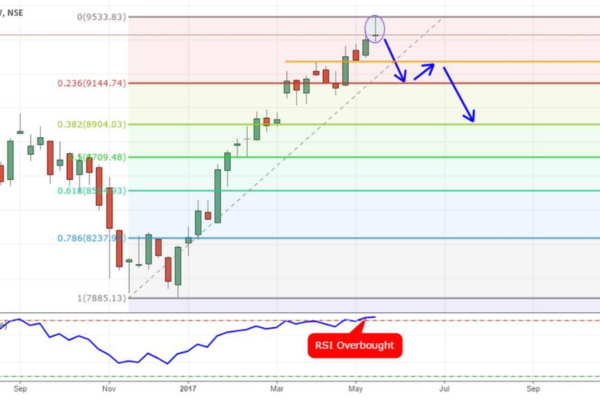
The Relative Strength Index (RSI) is an oscillator of momentum that ranges between 0 and 100. The formula reads RSI = 100 – [100 / (1 + RS)], where RS is the average gain/average loss (typically over the last 14 periods).
When the RSI climbs above 70, the security is overbought. When it drops below 30, it’s oversold.
This serves as an excellent directional indicator to provide traders with entry and exit points, but during extended trends, such as with Bitcoin in 2021, the RSI remains in overbought or oversold territory for days and weeks at a time. Adding this level of support makes it more likely to be correct.
Type 2: Risk Management Formulas
Risk management keeps traders in the game, and two formulas stand out: position sizing and risk-reward ratio.
Position Sizing Formulas:
Position sizing dictates how much we’re going to risk on a position. Fixed percentage means, for example, that a trader will always risk a certain fixed percentage per trade (1% of account equity, which means for a $10,000 account, that’s $100).
The Kelly Criterion is even more aggressive, traders’ recommended position size is based upon the win percentage and payout, using the Kelly Criterion at face value can be dangerous, however, so many traders use half.
There’s volatility, if things are insane one day, reducing position size will save the trader from getting blown out.
Risk-Reward Ratio Calculation:
Your risk-reward ratio, if you take your take-profit distance and divide it by your stop-loss distance, and you come up with the following number, you have a great ratio.
Arisk-reward ratio of 1:2 means that for every $1 you want to gain on the other side of the risk, you want to make $2. A day trader is comfortable with 1:1.5 to make quick money, and a swing trader will seek 1:3.
Uniform risk-reward ratios for all currency pairs, EUR/USD, etc, prevent daily losses from averaging out over time to be more than average daily profits.
Type 3: XHMaster Formula Indicator
The XHMaster Formula Indicator is a newer player, blending price action, volume, and timing into one sleek tool. Born from quant minds, it’s gaining traction for its precision.
Core Mathematical Components:
While we may never know the secret sauce, XHMaster analyzes price fluctuations (moving averages), volume fluctuations, and seasonality.
Available on some trading platforms, it offers signals and entries to supplement your XHMaster trading venture.
Its backtest results suggest a 60-70% win rate in trending markets, and user reviews note its effective reversal detection in GBP/USD during the tumultuous months of 2023.
Type 4: Volatility-Based Formulas
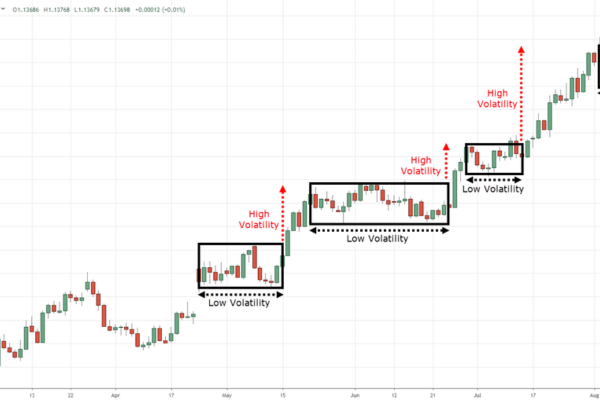
Volatility can make or break a trade, and ATR and Bollinger Bands help you harness it.
Average True Range (ATR):
ATR is the Average True Range. It measures the Average True Range (the extent of the high-low daily price movement) over 14 periods to assess volatility.
It can help with appropriate stop placement, a stop 2x ATR below an entry gives the trade breathing room based on daily price movements. If one trades a volatile stock like NVIDIA, position sizing with ATR will maintain proper risk.
Bollinger Bands:
Bollinger Bands use a 20-period moving average with bands two standard deviations away from it, above and below. They widen in times of volatility and tighten when activity is lessened.
The upper band theoretically represents a sell opportunity while the lower band represents a buy. This inflationary measure works best in a consistent atmosphere, for example, gold trading around the same value, with buy and sell opportunities before the breakout.
And It’s A Wrap!
Traders who rely upon the more formulaic type have more prosperous trades. Currency forex traders rely upon non-fundamental formulaic calculations via technical analysis like MACD and RSI to assess the direction and momentum of price changes.
Formulas for risk management abound as well, including position sizing and risk-reward ratios, which are used to safeguard trading capital. The XHMaster Formula Indicator is a formulaic aggregate that helps traders assess good entry and exit points.
Average True Range (ATR) and Bollinger Bands are formulas traders periodically assess to gauge market volatility. The more these formulaic types are blended and the more traders adapt due to the relative formulaic changes over time, the more successful they’ll be.
So, while all trading formulas come with a profit potential, they also have their own set of risks, including volatility, emotional trading decisions, and high transaction expenses. So, traders who depend on these formulas must have a comprehensive understanding of technical analysis, risk management strategies, and market trends to succeed.